GeoGraphVis
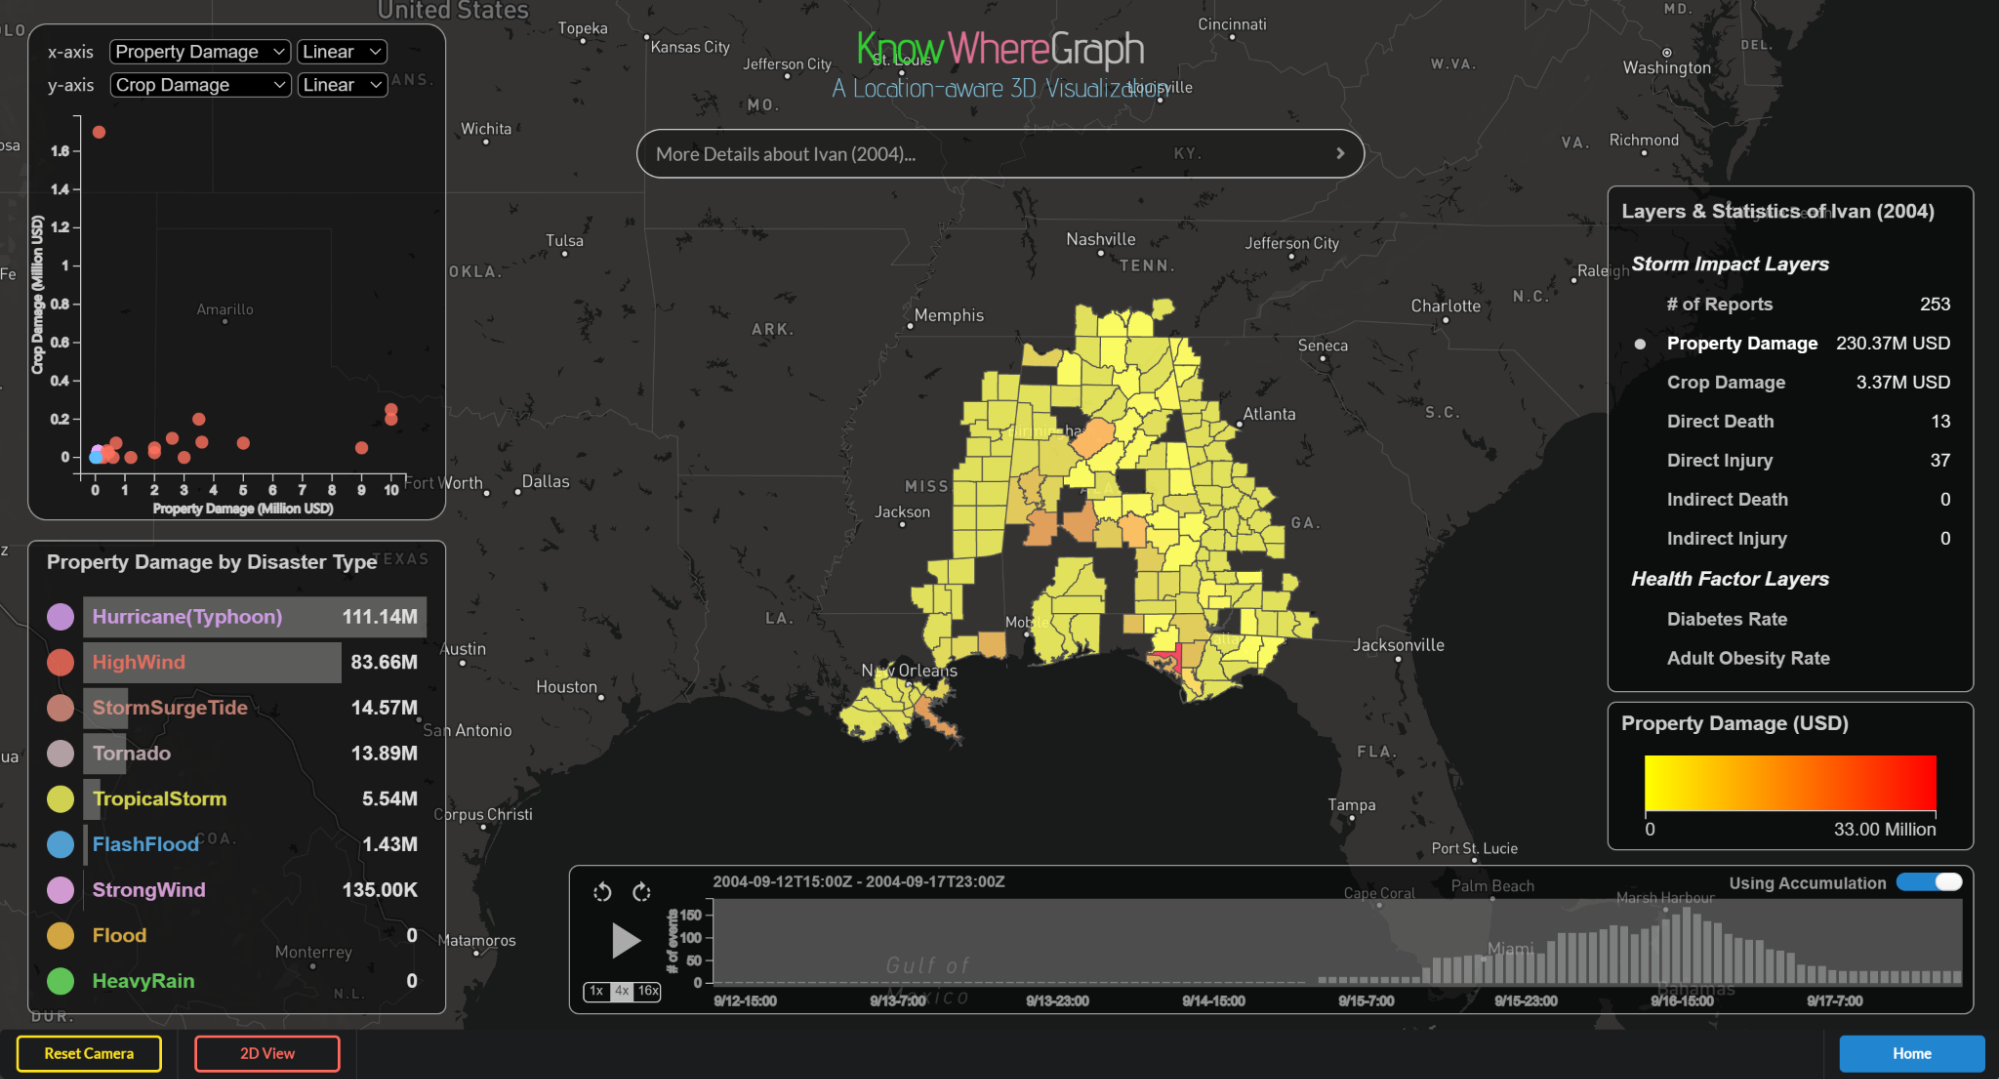
The GeoGraphVis tool, developed to support humanitarian response efforts following a disaster, visualizes data from KnowWhereGraph on a map. It allows a user to explore a hurricane's trajectory and impacts (e.g., death, property damage, etc.), health indicators related to the affected populations (e.g., prevalence of diabetes and obesity), as well as information on experts whose areas of expertise may critically support relief efforts. By presenting an integrated view, the platform quickly raises situational awareness regarding the environmental, infrastructure and social dimensions of a humanitarian disaster.
For example, to understand how hurricanes have affected the southeastern US in the years preceding Katrina, the GeoGraphVis tool allows us to browse data on hurricanes from the early 2000s. After glancing through the trajectory and wind speed trends for several storms, one can view records by county on property damage, loss of life and injuries caused by each storm (see the figure below). With a clearer picture of the physical effects of the storms, one can then turn their attention to explore health-related characteristics of southeastern US counties.
View GeoGraphVis