Humanitarian Support
Disasters are complex and dynamic situations requiring humanitarian organizations to evaluate and respond rapidly to many different issues simultaneously. Often, what is most needed to improve a response is quick access to the right experts at the right time. To assist in identifying people with expertise in humanitarian aid and relief, with a particular focus on health and the healthcare impacts of disasters, we are working with Direct Relief to showcase how our knowledge graph can give rapid access to area briefings, including information on previous events, and physical properties of the affected regions including climate, transportation infrastructure, and other key data points.
The 2020 hurricane season provides a good example. Many people residing in the state of Louisiana became internally displaced as a result of Hurricane Laura, a category 4 storm, which made landfall in late August. Only a few weeks later, Hurricane Delta made landfall in nearly the same location. What would have been a serious series of events under any circumstances was made additionally challenging due to COVID-19. The pandemic affected people's willingness to evacuate or seek refuge in emergency shelters. In complex situations like this, a relief organization has to rapidly acquire situational intelligence about the affected region, its population, previous impactful events (here, Hurricane Laura), local COVID-19 community spread forecasts, and so on. Then, based on an understanding of the particular situation, relief organizations must identify experts on the ground. Each of these steps takes multiple hours and meetings when time is of the essence. These events do not need to be of the same type. For instance, in some regions of the world, because disasters can compound the spread of diseases, it is essential to identify previous endemic disease outbreaks whenever a major storm hits. Since our data are spatially integrated, any information about climate, epidemiology, events, transportation, loss, and affected soils and crops, is just a few graph links away. In the following section, we will focus on the identification of experts and their expertise.
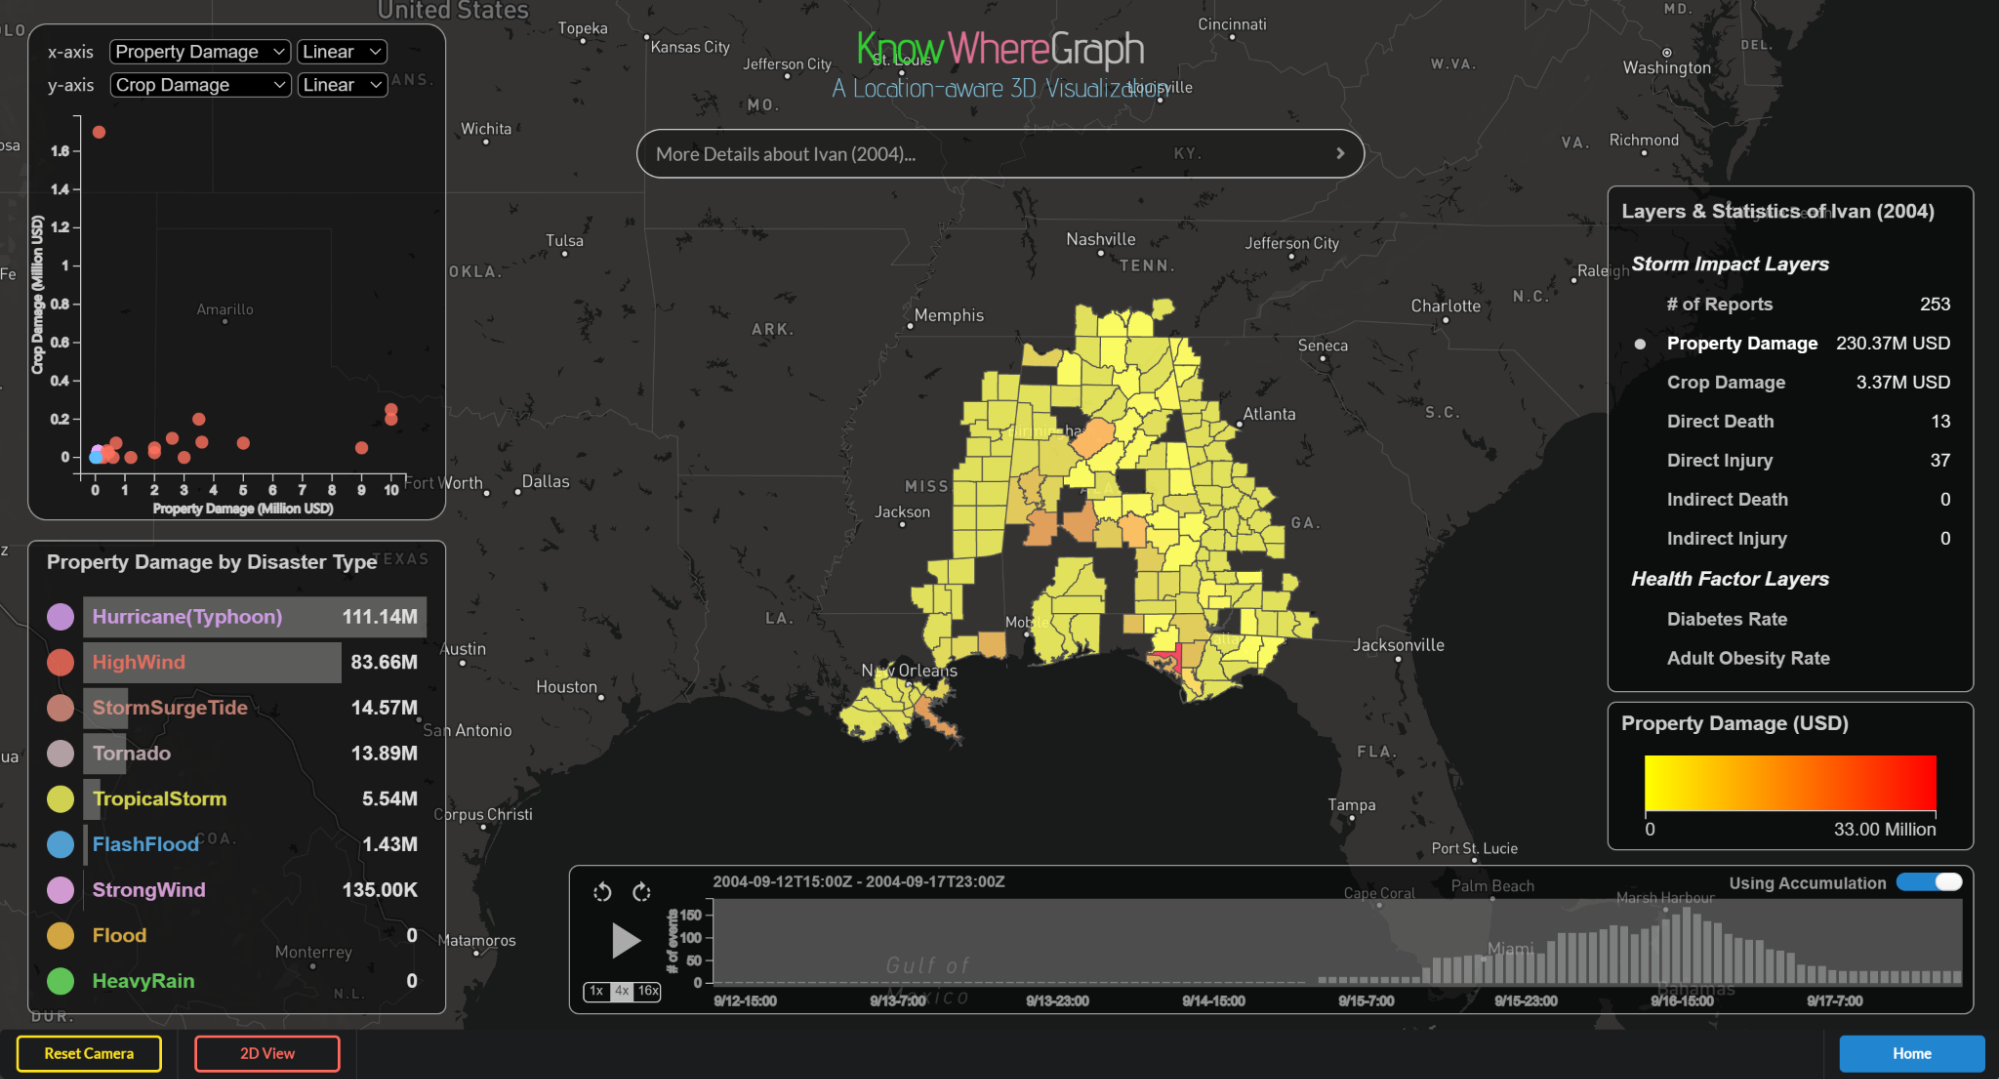
The KnowWhereGraph contains semantically defined, graph-ready data on several topics, including contact information for individuals with (1) expertise in specific emergency medical techniques and diseases; (2) expertise in types of hazards and disasters that could lead to specific medical concerns (e.g., floods leading to outbreaks of water-borne disease); and (3) experience (when relevant) in specific geographic regions, where cultural, religious, and political conditions may become significant factors in providing effective disaster relief. It also contains georeferenced data characterizing public health and socioeconomic conditions as well as physical parameters such as storm track and intensity, property damage, and other information that helps disaster responders tailor their response to the situations they are likely to face in an area (Figure 1). Such data do not yet appear to exist in organized, accessible formats over the Web or distributed sources, beyond personal social and organizational networks. Currently, our data are restricted to the United States. We aim at global coverage (at varying spatial resolutions) in the future.
To enable disaster relief specialists to easily access and explore the graph of experts, expertise, and disasters, we also plan to provide a similarity search interface, which is demonstrated in Figure 2, Left. A similarity search can be useful when it is known that some person's expertise would be ideal for consulting on some disaster incident, but that person is unavailable. In the similarity interface, users can enter that expert's name into the search box and the system will return experts who are most similar to the input expert. The similarity score is computed using a combination of Doc2Vec and knowledge graph embeddings. Figure 2 (Right) shows an example of the similarity search. From there, users can directly explore information about the experts, their area of expertise, and events that they have worked on. Conversely, users can also start by selecting a certain event or a geographic region, learn about previous events, their impacts, and experts who could be contacted. In fact, this ability to seamlessly navigate between physical events, event topics (expertise), affected regions and people is one of the key strengths of knowledge graphs such as our KWG.
